Sensestek
About
Sensestek is an IoT based energy monitoring platform designed for solar systems and green energy setups. The platform connects with sensors and smart devices to track real time energy generation, consumption, and system performance.
All data is collected, processed, and visualized through a centralized software interface that enables users to monitor efficiency, identify anomalies, and make informed energy decisions. The project focused on designing and developing a scalable platform that translates complex IoT data into clear and actionable insights.
Problem
Green energy systems generate large volumes of real time data, but this data is often fragmented across devices and difficult to interpret. Users struggle with limited visibility into system performance, delayed issue detection, and unclear energy consumption patterns. Existing platforms frequently present raw data without context, making it hard for operators and decision-makers to act on insights.
Solution
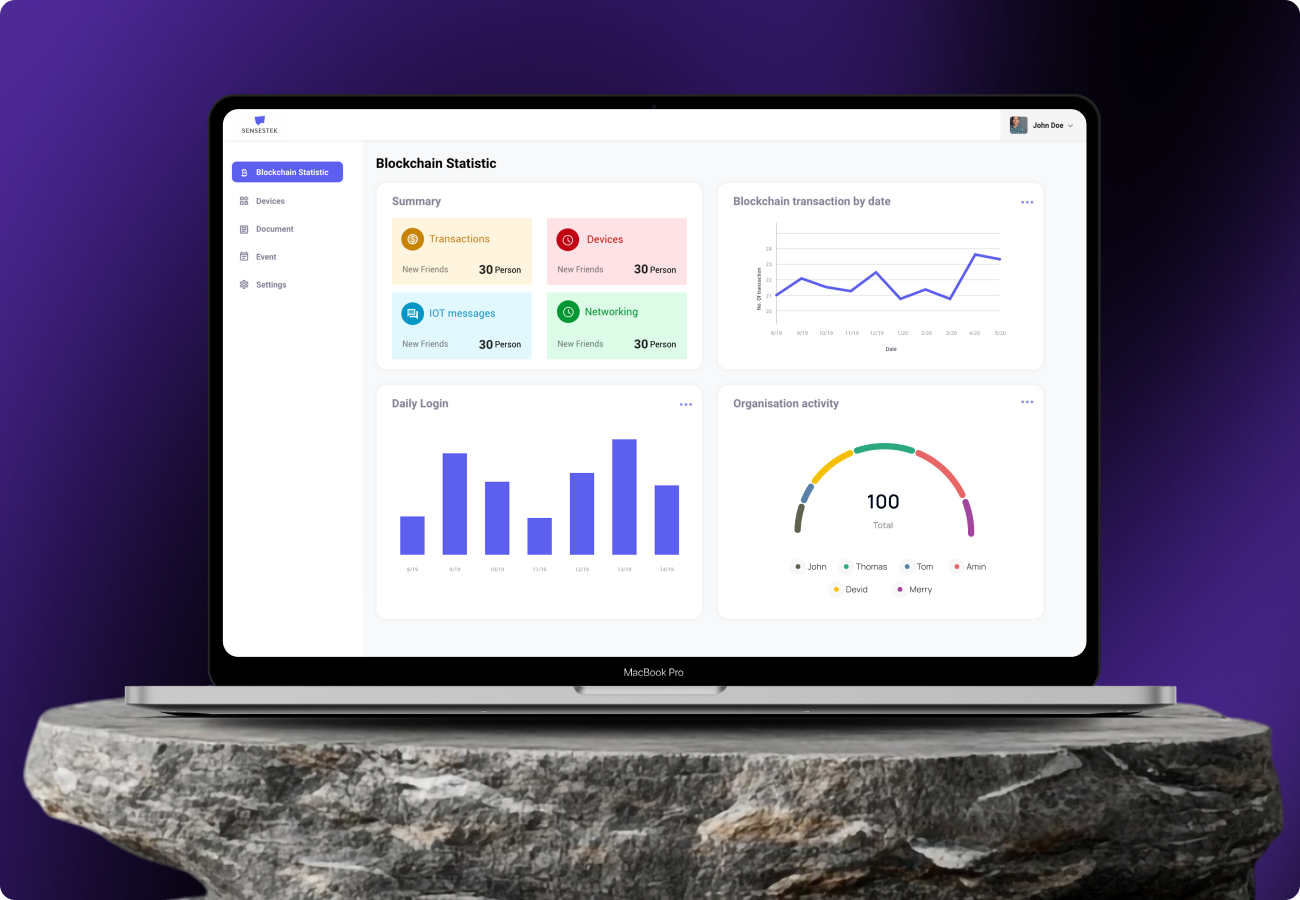
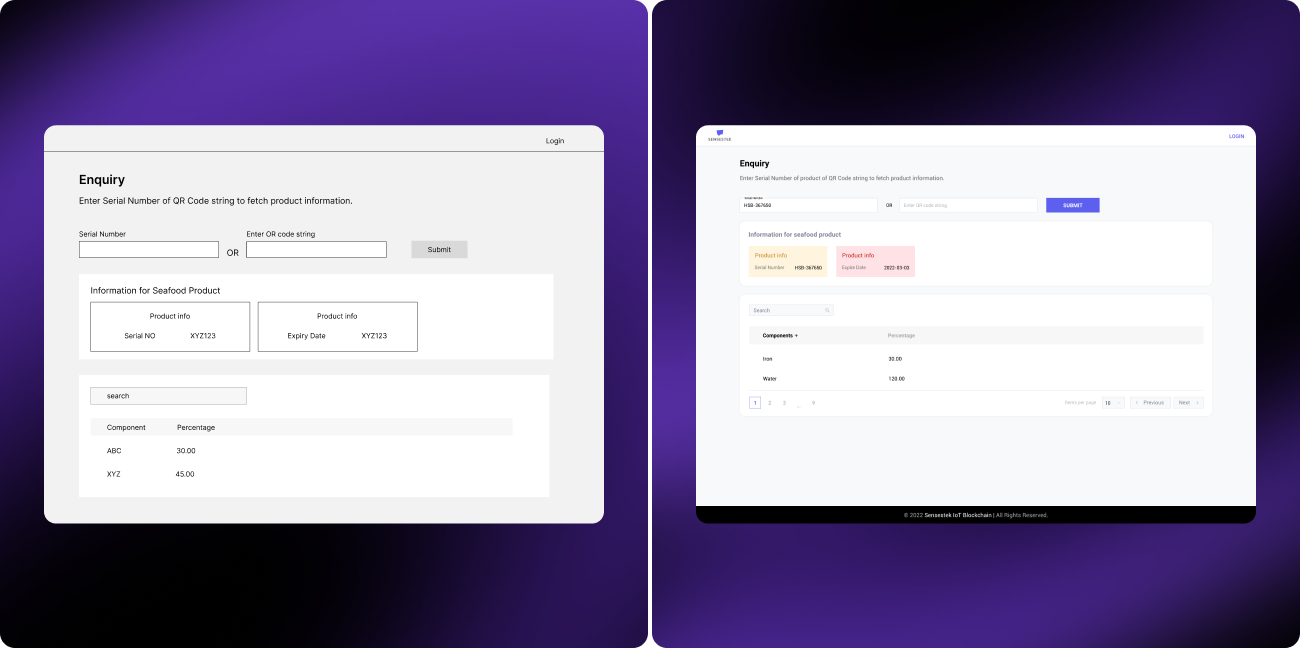
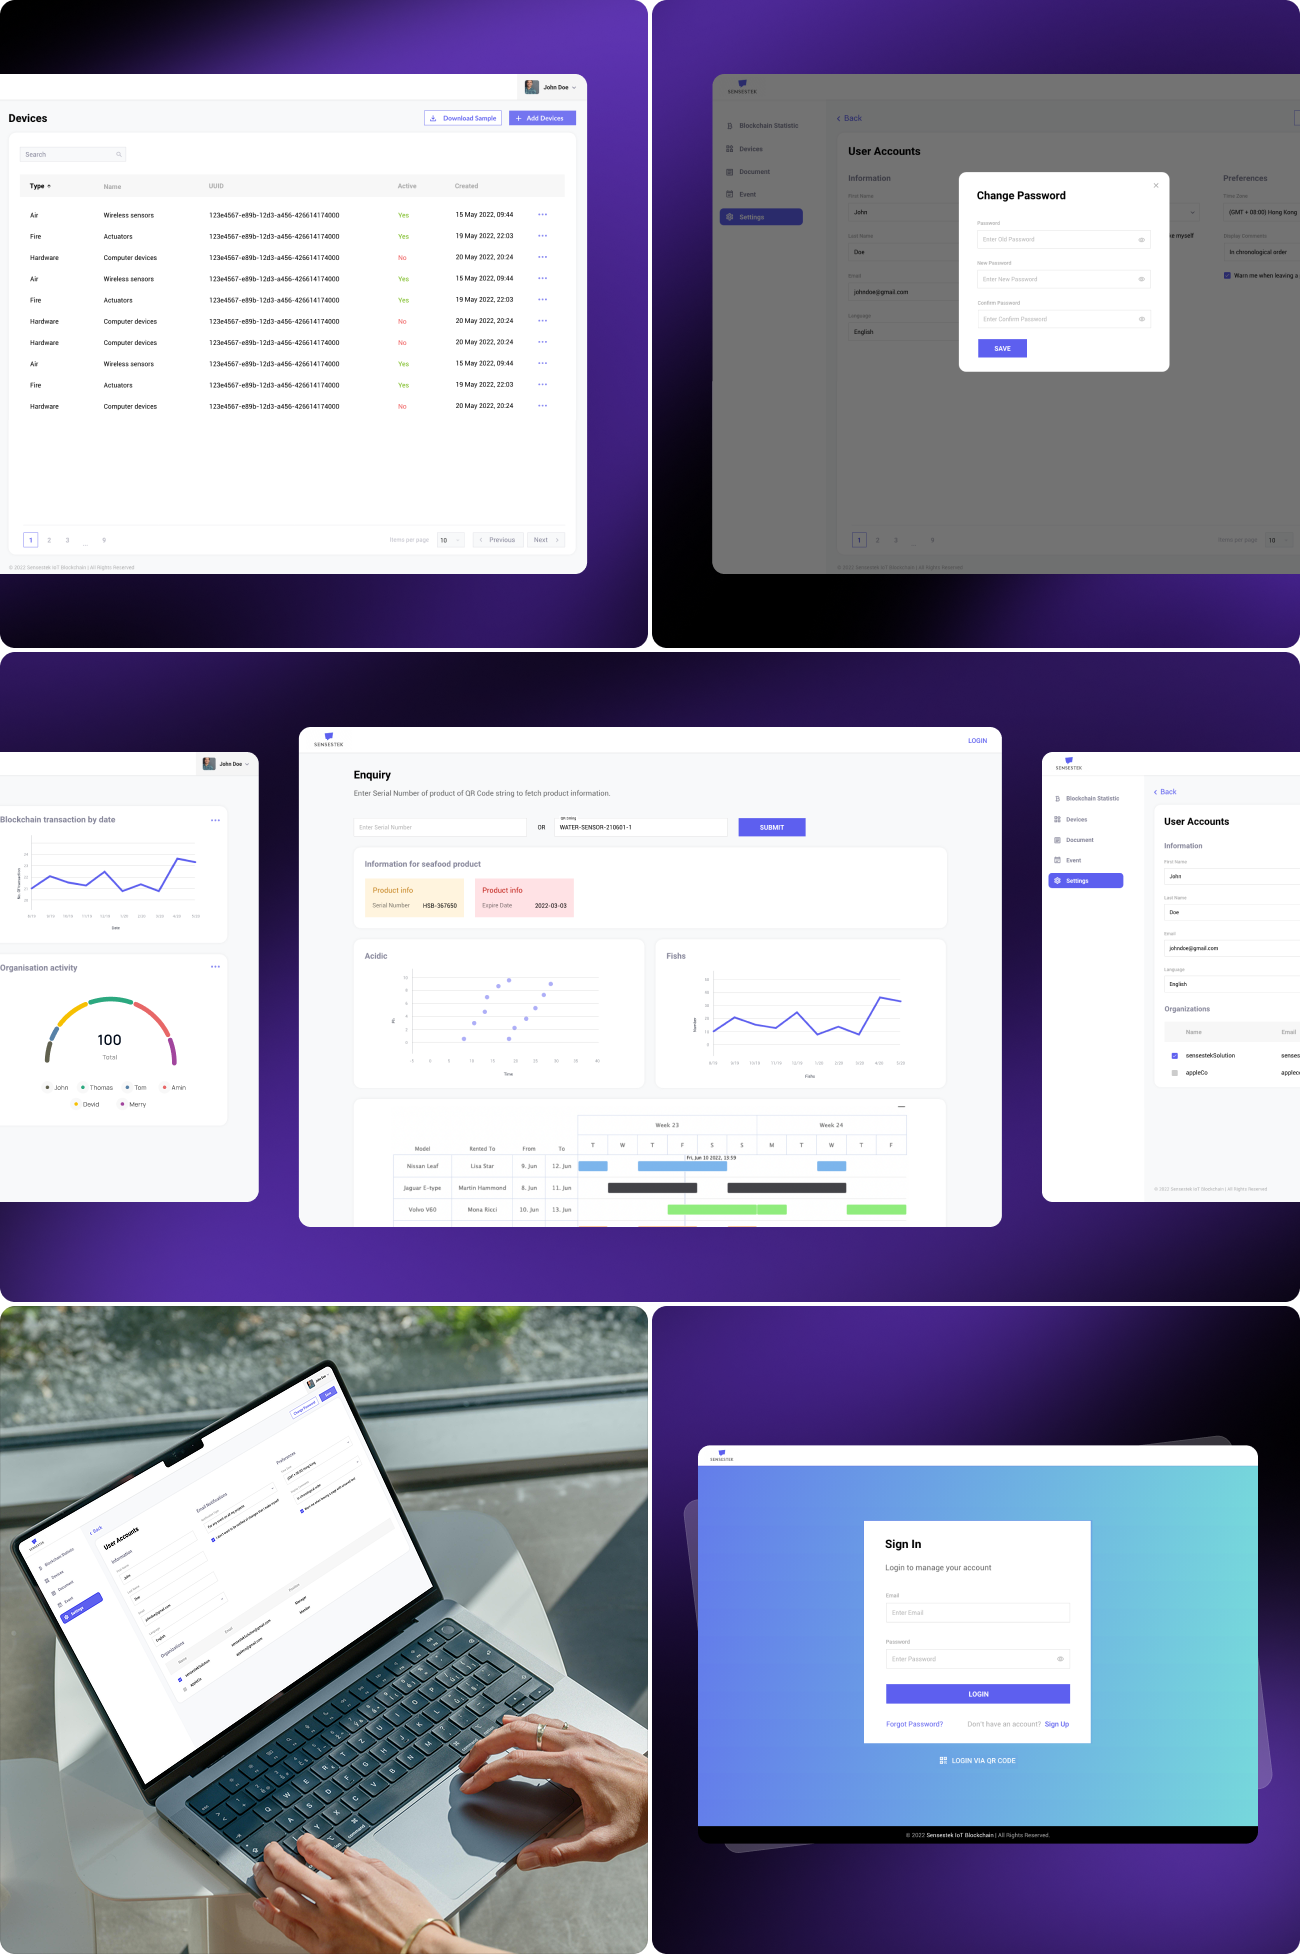
Sensestek provides a centralized monitoring platform that aggregates data from connected solar and energy devices into structured dashboards and reports. The platform enables real time tracking of energy generation, consumption trends, system health, and performance metrics. Interactive charts, status indicators, and alerts help users quickly understand system behavior and respond to issues.

From Concept to
The design concept focused on clarity, scalability, and real time data awareness. The interface was designed to convert continuous IoT data streams into intuitive visual representations through dashboards, graphs, and status modules. Progressive disclosure was used to balance high level insights with detailed system data.
User
User research targeted solar plant operators, facility managers, energy analysts, and sustainability teams. Insights showed that users prioritize real time visibility, historical data comparison, and easy identification of performance issues. Users also prefer dashboards that reduce cognitive load and present actionable insights rather than raw metrics.
User Interface
Sensestek follows a dashboard centric interface architecture built around real time monitoring and analysis. The architecture includes a high level overview dashboard for system health, detailed views for individual devices or sites, analytics modules for historical trends, and alert sections for anomaly detection.
Navigation is structured around energy assets and data categories, enabling users to move seamlessly between monitoring, analysis, and reporting workflows.
Style
The style guide emphasizes readability and data clarity across the platform. The typography system uses clean, modern fonts optimized for dashboards and numerical data. The color palette follows a sustainability inspired yet professional scheme, using contrast to differentiate data states, alerts, and performance indicators.
Software